


Early last year, I was messing around with the Desmos Graphing Calculator and was learning how to add bounds to lines. I also played around with circles and made animated lines.
I figured out a few things:
Using bounds at the end of a function such as y=2x{3<y<5} will make a line segment. This one will make a line with a slope of 2 that starts at (1.5,3) and ends at (2.5,5). These bounds can be either x or y variables and can be used on any line.
Animations are easier. You need to choose a variable that is any letter or symbol, excluding ones used in math including―but not limited to―the following: + – = * ( ) { } [ ] ^ / e r x y. Once you have one set up, it should become a slider. Let’s call ours “B”. We need to set bounds, using the blanks below the slider. These are set to -10 and 10 by default, but they can be changed easily. Also, the “step” function is how much it increases by, whether it be 1 or 0.1 or 0.0001. Once you have it set up, make a line using that variable. Ours could be y=Bx. Click the play button to the right of the slider and it should go automatically. The line will change as this changes.
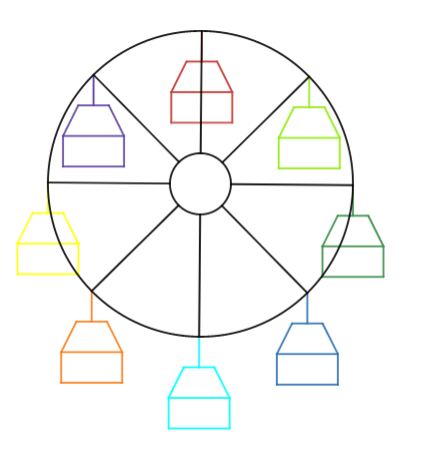
Now onto the ferris wheel.
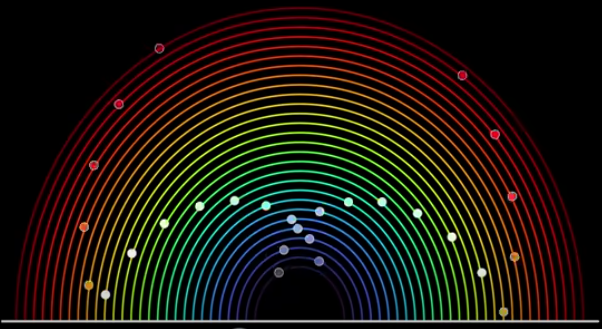
I set up just a few variables, the main one being “g”. This stretched from 1 to 360 with a step of 1. Then, I set up two more, the sin and cos. If you don’t know what these are, they are the y and x components of a circle with a radius of 1. For example, the sin of 90 degrees would be 1 because it would be 1 up and zero over. The sin was “t” and the cos was “f”. I used these to make “rungs” that stretched from the middle to the outside, a total of 4 of them. Then, I made new variables of “t” and “f” +45 degrees, named “j” and “h”. I made more “rungs” for 8 total. Also, I made “l”, which was how big the circle was, and “r”, which is how to actually make a circle in the graph. Once this was finished, I used some more trickery to make a smaller circle in the middle, so I had a donut cut into 8 parts. When the animation on “g” played, the donut spun!
Now onto the hard part. The chairs. Each chair had two variables. t_1, f_2,j_3,h_4 and so on. These were the points where the chair connected to the wheel―each 45 degrees from the other―and were in terms of the original f, t, j, and h, with negatives and positives separating them. Each chair consisted of 8 lines, a 1×2 rectangle, a trapezoidal roof, and another line connecting the chair to the wheel
Each line had to be written in terms of their respective variables. For example, Chair 1 had the variables f_1 and t_1. All 8 lines were connected to it. The bottommost line was the sin, or “t” minus two, with bounds of “f+1” and “f-1” Then with this on all of them, each chair could be fully moved by changing the variables. The chairs were connected to their respective variables, which were connected to the main ones, which were connected to “g”.
As”g” gets bigger, it spins.
desmos.com/calculator/vepoeiencz
Graph made by Colin Womack
Written by Colin Womack
Distribute if you wanna―idk, just credit me


spencer • Nov 13, 2023 at 12:07 pm
so true!!!